
Elevation Bands Layer
Turning it on
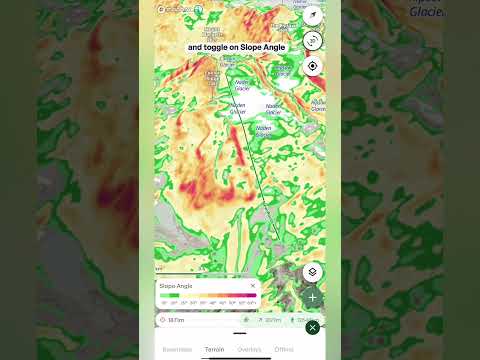
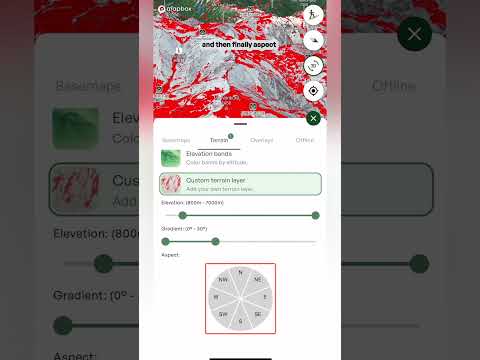
- Open the layers menu Tap the layers button on the map, go to the Terrain tab and tap Elevation bands. To turn it off, tap it again. A small number on the Terrain tab shows how many terrain layers are switched on.
Reading the map
- Light green to dark The whole map is colored by altitude. Light green is the lowest ground and the bands get darker the higher you go, so the summits show up as the darkest bands.
- The scale Look at the scale in the bottom left of the map. It shows which color matches which elevation range, so you can read the height of any spot straight off the map. Best for: tilting the map into 3D and seeing how the mountain stacks up from valley to summit.
What it's good for
- Matching the forecast Weather in the mountains changes with elevation. Plot a route, check the freezing level in the route's Weather tab, then use Elevation bands to see exactly which parts of your route sit above or below it.
- Treeline If you know roughly where the treeline sits, you can see where your route climbs out of the trees and into more open terrain.
- Judging the climb See how much height you gain and where the big steps up are, without reading contour lines.
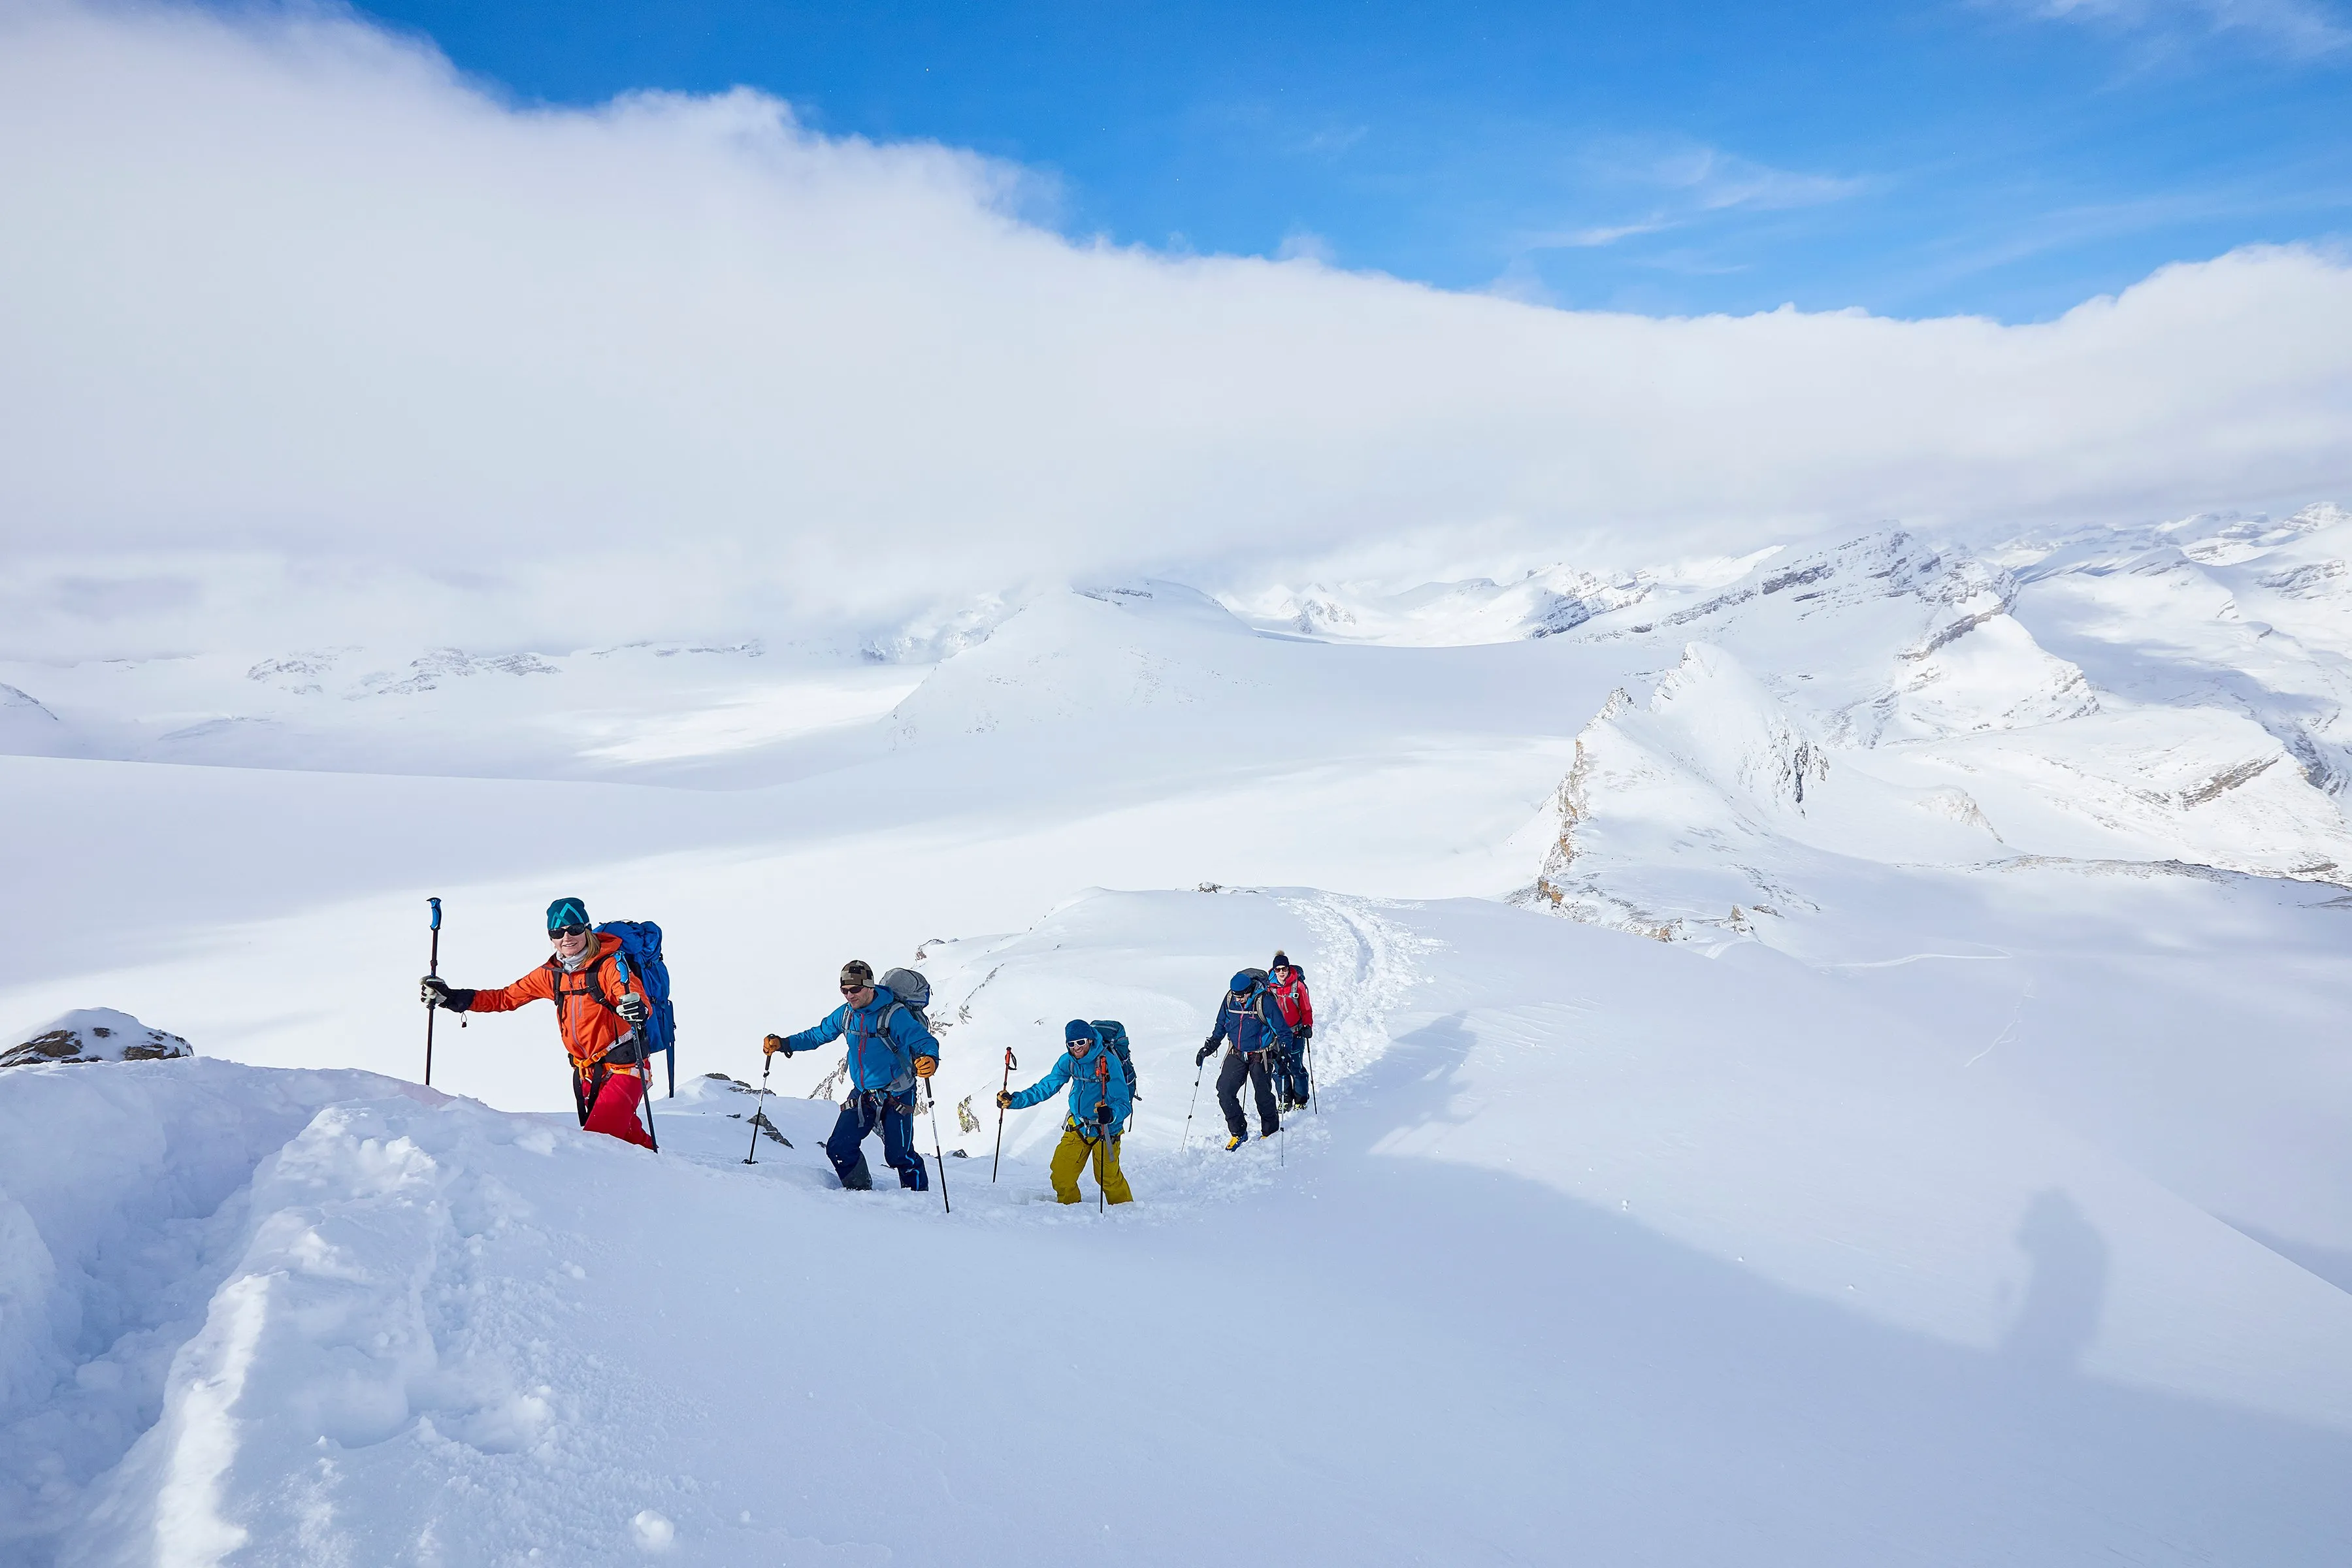
- Comparing objectives See at a glance which peaks, ridges and basins sit higher than the others around them.
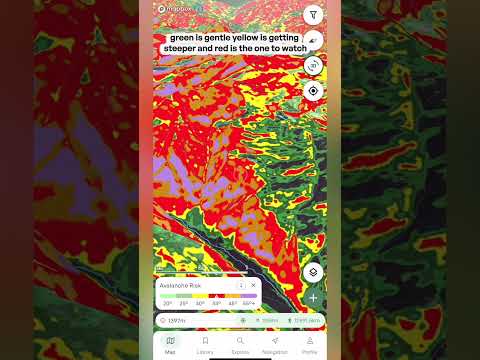
- Pairing with other layers Use it alongside layers like Slope angle to build a fuller picture of the terrain.