
Outmap Academy – Learn to use Outmap

Short educational videos that help you understand the tools, assess terrain and make more informed decisions in the mountains

Getting Started

Set up your account the right way before your first trip out.

Customise your Settings and Privacy
Watch video

Customise your Settings and Privacy

Set your units, choose a coordinate format, and decide whether your recorded activities stay private or help build anonymous community heatmaps.

Read feature guide

Preferences

  • Units Choose how Outmap shows distance, speed and pressure.
    • Metric:  uses kilometres, km/h and kPa.
    • Imperial:  switches everything over to the imperial equivalents.
    It applies across the whole app, so distances, elevations and speeds all follow the same system. Best for: seeing numbers in the units you already think in, so a 12 km route or a 1,200 m climb means something at a glance.
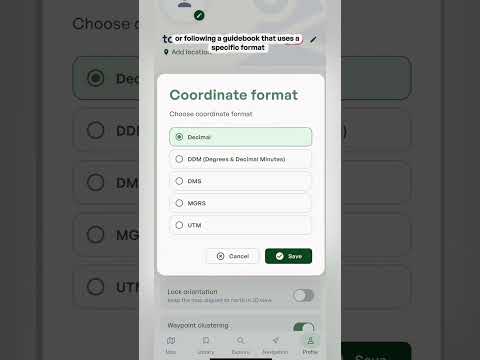
  • Coordinate format Choose how locations are written.
    • Decimal (the default):  a single pair of numbers, like 49.2827, -123.1207.
    • DMS:  splits each number into degrees, minutes and seconds.
    • MGRS:  a grid system that gives a position in metres across a map grid.
    • UTM:  another grid system that gives a position in metres across a map grid.
    Every format points to the exact same spot, and Outmap uses WGS84, the same standard as GPS and most apps, so your coordinates will match what your phone or watch shows. Best for: sharing a location with a rescue team, or following a guidebook that uses a specific format. Pick whichever the other person or the book expects.
  • Bearing reference Choose between true north and magnetic north for your bearings.
    • True north:  points to the North Pole.
    • Magnetic north:  is where a compass needle points.
    The two can be several degrees apart depending on where you are. Best for: matching a physical compass. If you navigate with one, pick magnetic north so the bearings in Outmap line up with what your compass shows.
  • Lock orientation Keeps the map pointing north in 2D view, so it doesn't rotate as you turn or move. Best for: always knowing which way is north at a glance, and matching the map to the terrain in front of you without it spinning.
  • Waypoint clustering Groups nearby waypoints into a single marker when you're zoomed out, so the map doesn't fill up with pins. Zoom in and they spread back out. Best for: busy areas with lots of waypoints close together.
  • Contour lines Shows terrain contour lines on top of satellite imagery. Each line joins points at the same elevation, so lines close together mean steep ground and lines far apart mean gentle ground. Best for: reading the shape of the terrain, like ridges, gullies and how steep a slope is, while you're on a satellite view.
  • Keep screen awake Stops your phone's display from turning off while Outmap is open. Best for: navigating on the go, so the screen doesn't lock while you're checking the map. It does use more battery, so switch it off when you don't need it.
  • Metric:  uses kilometres, km/h and kPa.
  • Imperial:  switches everything over to the imperial equivalents.
  • Decimal (the default):  a single pair of numbers, like 49.2827, -123.1207.
  • DMS:  splits each number into degrees, minutes and seconds.
  • MGRS:  a grid system that gives a position in metres across a map grid.
  • UTM:  another grid system that gives a position in metres across a map grid.
  • True north:  points to the North Pole.
  • Magnetic north:  is where a compass needle points.

Tracking

  • Stats in notifications Shows your live stats in a notification while you're tracking an activity. Best for: checking distance and time at a glance without opening the app.

Privacy

  • Recorded activity privacy Choose whether your new recorded activities stay private, or can be used to build anonymous community heatmaps.
    • Private:  only you see your tracks.
    • Opted in:  your activity can be used to build anonymous community heatmaps.
    You can change this at any time.
  • Private:  only you see your tracks.
  • Opted in:  your activity can be used to build anonymous community heatmaps.
Tip:  play around with these settings to find what works best for you.
‍

‍

Skiing Activity layer
Watch video

Skiing Activity layer

See every lift and run at your favourite resorts, plus a large range of backcountry touring routes, each with its own gradient profile.

Read feature guide

Choosing your activities

  • Open the activity selector On the map, tap the activity button at the top right (it shows a small number for how many activities are selected). A panel called Map content opens with the heading "Select the activities you want to see." Pick from Mountain Bike, Hike, Ski, Climb and Trail Running.
  • Pick more than one You can select several activities at once. The number on the button updates to show how many are on, and tapping a selected activity again turns it off. Best for: trips that mix activities, like hiking in and skiing out.
  • What it changes Your selection decides what shows up on the map, and what Outmap suggests when you start a new route or waypoint. Best for: keeping the map focused on the activity you're planning, so it isn't cluttered with things you don't need.

The Ski layer

  • Resort skiing Every lift and run at your favourite resorts appears on the map. You can see how a resort is laid out, where the lifts go and which runs come off them, before you ever get there. Best for: working out which runs suit you and your group.
  • Backcountry skiing Alongside the resorts you'll see a large range of backcountry ski touring routes. Browse the routes in your favourite areas to see what's already been mapped, then tap one for the details. Best for: finding a tour in an area you don't know yet.
  • Steepness at any point Tap any marked run or route to see its gradient profile, which shows how steep it is at every point along the way. It takes the guesswork out of a run you haven't skied before. Best for: knowing how steep a pitch is before you drop in.
  • Ski touring route details Tap a touring route to see its gradient, aspect, distance and estimated journey time. You also get a 36-hour mountain forecast for that exact location, not the nearest town. Best for: picking a tour that fits the day you have and the weather that's coming.
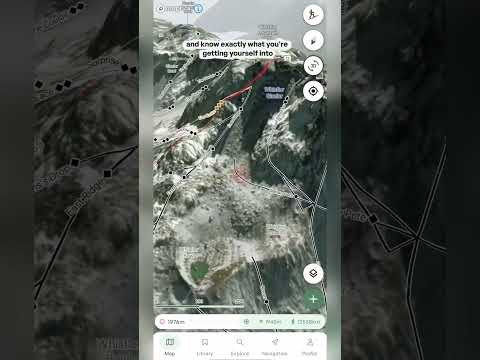
  • 3D terrain Tilt the map into 3D to look at the terrain the way you'll see it on the mountain. You can inspect the slopes and know exactly what you're getting yourself into before you commit. Best for: checking the steep sections, and what sits above and below them, from your couch.

Using the layers together

  • Combine with other layers Every activity layer works with the other layers on the map. Try it with Slope angle (Pro) to see how steep the terrain is, or with the Heatmap layers to see where people actually go. Best for: getting the full picture of an area before you choose a line.
  • Plan your own route Whichever activity you choose, you can build your own route with the route planning tool. See Plotting a route.
  • Details on tap On every activity layer you can tap a trail, run, route or crag to see its details, and each one comes with a 36-hour mountain forecast for that exact spot.
Tip:  you can change your activities at any time, so switch them as you plan different trips.
Important:  the activity layers show you where runs, routes, trails and crags are, not whether they are safe on the day. Conditions change, so check the Avalanche forecast and the weather before you go, and always rely on your own training and judgment, especially in the backcountry.

‍

‍

Hiking Activity Layer
Watch video

Hiking Activity Layer

Find established hiking trails with their distance and elevation profile, or plot your own route to a peak with no marked trail.

Read feature guide

Choosing your activities

  • Open the activity selector On the map, tap the activity button at the top right (it shows a small number for how many activities are selected). A panel called Map content opens with the heading "Select the activities you want to see." Pick from Mountain Bike, Hike, Ski, Climb and Trail Running.
  • Pick more than one You can select several activities at once. The number on the button updates to show how many are on, and tapping a selected activity again turns it off. Best for: trips that mix activities, like hiking in and skiing out.
  • What it changes Your selection decides what shows up on the map, and what Outmap suggests when you start a new route or waypoint. Best for: keeping the map focused on the activity you're planning, so it isn't cluttered with things you don't need.

The Hike layer

  • Trail network The hiking trails layer shows established routes, with details like distance and elevation profile. Tap a trail to see them. Best for: finding a proven route in an area you don't know.
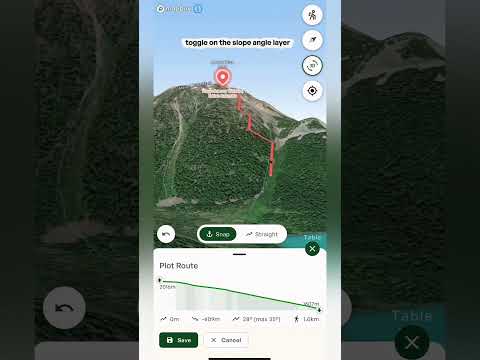
  • Going off trail If you see a peak with no marked trail, drop a waypoint on it, tap Create Route, then add points along the line you'd like to take. Popular apps mostly show routes thousands of people already follow, and this lets you build your own. Best for: escaping the crowds and finding routes nobody else is on.
  • Snap or Straight While you plot, choose Snap to follow existing trails or Straight to draw straight lines between your points. Use the undo button if you make a mistake. Best for: mixing marked trails with off-trail sections on the same route.
  • Staying within your limits Switch on the Slope angle layer (a Pro layer) alongside your route to see whether any part of it is steeper than you want to take on. Best for: making sure your line isn't steeper than your group is comfortable with.
  • Full route stats Once your route is plotted you get the elevation profile, distance, estimated travel time and pace, and the aspects your route crosses. There's also a 36-hour forecast for the route's exact location. Best for: knowing how long the day will be, and what the weather will do, before you leave.

Using the layers together

  • Combine with other layers Every activity layer works with the other layers on the map. Try it with Slope angle (Pro) to see how steep the terrain is, or with the Heatmap layers to see where people actually go. Best for: getting the full picture of an area before you choose a line.
  • Plan your own route Whichever activity you choose, you can build your own route with the route planning tool. See Plotting a route.
  • Details on tap On every activity layer you can tap a trail, run, route or crag to see its details, and each one comes with a 36-hour mountain forecast for that exact spot.
Tip:  you can change your activities at any time, so switch them as you plan different trips.
Important:  the activity layers show you where runs, routes, trails and crags are, not whether they are safe on the day. Conditions change, so check the Avalanche forecast and the weather before you go, and always rely on your own training and judgment, especially in the backcountry.

‍

‍

Climbing Activity layer
Watch video

Climbing Activity layer

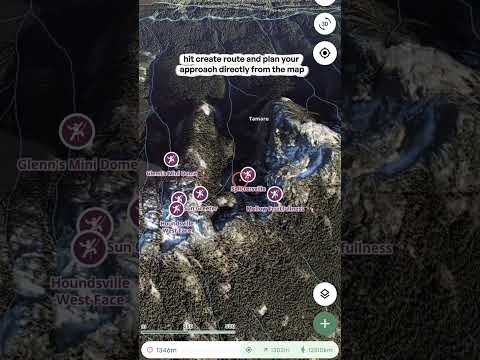
Browse hundreds of crags by name, tap one for its details and local forecast, then plot your approach straight from the map.

Read feature guide

Choosing your activities

  • Open the activity selector On the map, tap the activity button at the top right (it shows a small number for how many activities are selected). A panel called Map content opens with the heading "Select the activities you want to see." Pick from Mountain Bike, Hike, Ski, Climb and Trail Running.
  • Pick more than one You can select several activities at once. The number on the button updates to show how many are on, and tapping a selected activity again turns it off. Best for: trips that mix activities, like hiking in and skiing out.
  • What it changes Your selection decides what shows up on the map, and what Outmap suggests when you start a new route or waypoint. Best for: keeping the map focused on the activity you're planning, so it isn't cluttered with things you don't need.

The Ski layer

  • Resort skiing Every lift and run at your favourite resorts appears on the map. You can see how a resort is laid out, where the lifts go and which runs come off them, before you ever get there. Best for: working out which runs suit you and your group.
  • Backcountry skiing Alongside the resorts you'll see a large range of backcountry ski touring routes. Browse the routes in your favourite areas to see what's already been mapped, then tap one for the details. Best for: finding a tour in an area you don't know yet.
  • Steepness at any point Tap any marked run or route to see its gradient profile, which shows how steep it is at every point along the way. It takes the guesswork out of a run you haven't skied before. Best for: knowing how steep a pitch is before you drop in.
  • Ski touring route details Tap a touring route to see its gradient, aspect, distance and estimated journey time. You also get a 36-hour mountain forecast for that exact location, not the nearest town. Best for: picking a tour that fits the day you have and the weather that's coming.
  • 3D terrain Tilt the map into 3D to look at the terrain the way you'll see it on the mountain. You can inspect the slopes and know exactly what you're getting yourself into before you commit. Best for: checking the steep sections, and what sits above and below them, from your couch.

The Hike layer

  • Trail network The hiking trails layer shows established routes, with details like distance and elevation profile. Tap a trail to see them. Best for: finding a proven route in an area you don't know.
  • Going off trail If you see a peak with no marked trail, drop a waypoint on it, tap Create Route, then add points along the line you'd like to take. Popular apps mostly show routes thousands of people already follow, and this lets you build your own. Best for: escaping the crowds and finding routes nobody else is on.
  • Snap or Straight While you plot, choose Snap to follow existing trails or Straight to draw straight lines between your points. Use the undo button if you make a mistake. Best for: mixing marked trails with off-trail sections on the same route.
  • Staying within your limits Switch on the Slope angle layer (a Pro layer) alongside your route to see whether any part of it is steeper than you want to take on. Best for: making sure your line isn't steeper than your group is comfortable with.
  • Full route stats Once your route is plotted you get the elevation profile, distance, estimated travel time and pace, and the aspects your route crosses. There's also a 36-hour forecast for the route's exact location. Best for: knowing how long the day will be, and what the weather will do, before you leave.

The Climb layer

  • Crags across the map Hundreds of crags appear on the map with their names, giving you an instant overview of what's out there in any area. They range from accessible crags for beginners to harder lines for experienced climbers. Best for: finding new spots, whether you sport climb, trad climb or boulder.
  • Crag details Tap any crag to see its info and description, plus the weather forecast for that exact location. Best for: checking the conditions at a specific crag, not just the nearest town.
  • Plan the approach Tap Create Route to plot your walk in straight from the map. Your ascent, descent and distance update as you go, so you know how long the approach is. Best for: working out how to get to a crag you haven't been to before.
  • 3D imagery Tilt into 3D to see the crag and the terrain around it before you leave the house. Best for: understanding what you're walking into on the approach.

The Mountain Bike layer

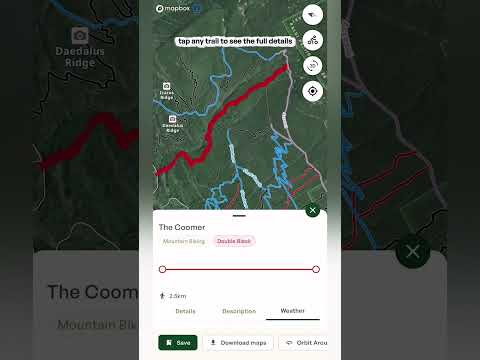
  • Every trail in your area All the trails around you are color-coded by difficulty, from beginner-friendly routes through to the most technical lines. Best for: finding a trail at your level, or the next step up.
  • Trail details Tap any trail to see its distance, elevation profile and gradient, so you know exactly what you're getting into before you leave the house.
  • 3D terrain Use the 3D terrain layers to view a trail from above and spot the climbs, descents and technical sections before you get there. Best for: scoping out a new trail, or planning a big ride.
  • Weather Check the forecast for the exact trail location for the next 36 hours.
  • Offline maps Download an offline map of the area so you always have navigation, even without signal. Offline maps are a Pro feature in the mobile app. Best for: remote trails where you won't have any service.
  • Trail runners The same layer works just as well if you run. Use it to find and plan your next trail run.

Using the layers together

  • Combine with other layers Every activity layer works with the other layers on the map. Try it with Slope angle (Pro) to see how steep the terrain is, or with the Heatmap layers to see where people actually go. Best for: getting the full picture of an area before you choose a line.
  • Plan your own route Whichever activity you choose, you can build your own route with the route planning tool. See Plotting a route.
  • Details on tap On every activity layer you can tap a trail, run, route or crag to see its details, and each one comes with a 36-hour mountain forecast for that exact spot.
Tip: you can change your activities at any time, so switch them as you plan different trips.
Important: the activity layers show you where runs, routes, trails and crags are, not whether they are safe on the day. Conditions change, so check the Avalanche forecast and the weather before you go, and always rely on your own training and judgment, especially in the backcountry.
Mountain Biking Activity Layer
Watch video

Mountain Biking Activity Layer

Every trail around you is color-coded by difficulty, from beginner-friendly to the most technical lines, with distance, elevation and gradient for each.

Read feature guide

Choosing your activities

  • Open the activity selector On the map, tap the activity button at the top right (it shows a small number for how many activities are selected). A panel called Map content opens with the heading "Select the activities you want to see." Pick from Mountain Bike, Hike, Ski, Climb and Trail Running.
  • Pick more than one You can select several activities at once. The number on the button updates to show how many are on, and tapping a selected activity again turns it off. Best for: trips that mix activities, like hiking in and skiing out.
  • What it changes Your selection decides what shows up on the map, and what Outmap suggests when you start a new route or waypoint. Best for: keeping the map focused on the activity you're planning, so it isn't cluttered with things you don't need.

The Mountain Bike layer

  • Every trail in your area All the trails around you are color-coded by difficulty, from beginner-friendly routes through to the most technical lines. Best for: finding a trail at your level, or the next step up.
  • Trail details Tap any trail to see its distance, elevation profile and gradient, so you know exactly what you're getting into before you leave the house.
  • 3D terrain Use the 3D terrain layers to view a trail from above and spot the climbs, descents and technical sections before you get there. Best for: scoping out a new trail, or planning a big ride.
  • Weather Check the forecast for the exact trail location for the next 36 hours.
  • Offline maps Download an offline map of the area so you always have navigation, even without signal. Offline maps are a Pro feature in the mobile app. Best for: remote trails where you won't have any service.
  • Trail runners The same layer works just as well if you run. Use it to find and plan your next trail run.

Using the layers together

  • Combine with other layers Every activity layer works with the other layers on the map. Try it with Slope angle (Pro) to see how steep the terrain is, or with the Heatmap layers to see where people actually go. Best for: getting the full picture of an area before you choose a line.
  • Plan your own route Whichever activity you choose, you can build your own route with the route planning tool. See Plotting a route.
  • Details on tap On every activity layer you can tap a trail, run, route or crag to see its details, and each one comes with a 36-hour mountain forecast for that exact spot.
Tip:  you can change your activities at any time, so switch them as you plan different trips.
Important:  the activity layers show you where runs, routes, trails and crags are, not whether they are safe on the day. Conditions change, so check the Avalanche forecast and the weather before you go, and always rely on your own training and judgment, especially in the backcountry.

Maps & Basemaps

Pick the right view of the mountain, then explore it in 3D.

Picking your basemaps
Watch video

Picking your basemaps

Switch between the Terrain, Satellite and Adaptive basemaps, then choose a satellite imagery source: Low resolution satellite (free), or Maxar, Mapbox, Winter Beta or Recent Imagery with Pro.

Read feature guide

Basemap style

  • Terrain The topographic map view, drawn like a traditional paper map. Best for: reading trails, roads and place names, and getting a feel for the lay of the land.
  • Satellite Satellite imagery of the ground. Best for: seeing what's actually out there, like snow cover, trees, rock and cliffs.
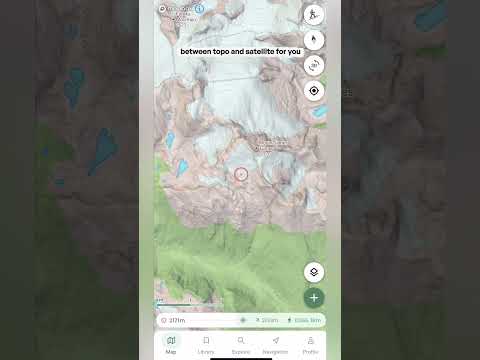
  • Adaptive Switches between the topographic map and satellite imagery for you. Tilt from 2D into 3D and it switches from topo to satellite, and in 2D it also switches to satellite once you zoom in far enough. See the short Adaptive video for a full breakdown.

Satellite imagery

  • Low resolution satellite Free satellite imagery with reduced detail. This is the satellite option on Basic, and a good way to get a feel for the terrain before you upgrade.
  • Maxar High-resolution satellite imagery. Pro.
  • Mapbox Balanced clarity and performance. Pro. Try Maxar and Mapbox side by side and see which you prefer for your area.
  • Winter Beta Seasonal, snow-focused imagery where available, still in beta. Pro.
  • Recent Imagery Imagery from the last 30 days, refreshed daily. Pro.

Contour lines

  • Contour lines Turn this on to display contour lines over satellite imagery. Each line joins points at the same elevation, so lines close together mean steep ground and lines far apart mean gentle ground. Best for: reading the shape of the terrain, like ridges and gullies, when you're on a satellite view.

‍

Adaptive Basemap
Watch video

Adaptive Basemap

Adaptive switches between the topographic map and satellite imagery automatically. Tilt from 2D into 3D and it switches from topo to satellite, and in 2D it also switches to satellite once you zoom in far enough. This short video shows how it works and when to use it.

Read feature guide

Adaptive switches between the topographic map and satellite imagery automatically. Tilt from 2D into 3D and it switches from topo to satellite, and in 2D it also switches to satellite once you zoom in far enough. This short video shows how it works and when to use it.

Map controls & 3d in Outmap
Watch video

Map controls & 3d in Outmap

Tilt, rotate and zoom the map to see terrain the way you'll actually encounter it, not just from above. Then learn the buttons that bring you back to north or centre the map on where you are.

Read feature guide

Moving around in 3D

  • 3D button Tap the 3D button to tilt the map into 3D. Best for: a quick way into 3D without any gestures.
  • Tilt Swipe up or down with two fingers to tilt the map up and down. Best for: seeing how steep a slope really is, which is hard to judge from straight above.
  • Rotate Twist with two fingers, moving one up and the other down, as if you're spinning the map. Best for: looking at a slope from every side.
  • Zoom Pinch to zoom out, and spread your fingers to zoom in.
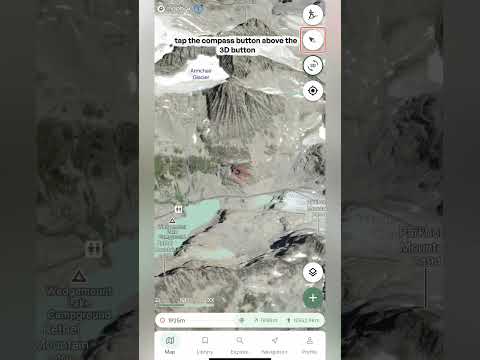
  • North button Tap the compass button above the 3D button to bring the map back to north. Handy after you've rotated the map and lost track of which way is which.
  • Centre on me Tap the location button once to centre the map on your location. Double tap it and the map turns to match the direction your phone is pointing, with the little blue arrow showing the way you're facing. Best for: working out which way to head when you're standing on the mountain.
Scout any Objective
Watch video

Scout any Objective

Tap any objective on the map, or drop your own waypoint, to get a full profile: how far away it is, its coordinates, sun and moon times, a written description and a forecast for that exact spot. Then create a route straight there.

Read feature guide

There are three ways in: tap an objective on the map, search for it, or drop your own waypoint. Whichever you choose, a panel slides up from the bottom with everything about that spot. Drag it up to see more.

The header

  • Name, type and elevation The name, its height above sea level, and a label for what it is when it has one, such as Alpine Hut.
  • To you How it compares to where you are right now: the height difference, the distance, and the bearing to get there. The T next to the bearing means true north. Best for: a quick sense of how far and how high an objective is from where you're standing.

Details tab

  • Location The exact coordinates, with the datum shown underneath. Tap the copy icon to copy them in one tap. Best for: sending a precise location to a friend, or pasting it into another app.
  • Local time, timezone and elevation The time there, its timezone and its height. Handy when you're planning a trip somewhere in a different timezone.
  • Nearby The closest town or area, so you know roughly where the spot is.
  • Open in mapping application Opens the location in another maps app on your phone, which is handy for getting driving directions to the trailhead.
  • Sun & Moon Sunrise and sunset, first light (dawn) and last light (dusk), plus the moon's illumination and direction, and moonrise and moonset. Sunrise, sunset, moonrise and moonset also show the compass direction they happen in. Best for: timing a dawn start, knowing how much daylight you really have, and judging how bright the night will be.

Description tab

  • AI-generated description A written overview of the objective: what it is, who looks after it, what's there, and any rules or reservations that apply. For a hut, for example, it covers things like capacity, amenities and whether you need to book. Best for: getting the practical details before you dig into maps and forecasts. Available on marked objectives, not on waypoints you drop yourself. AI descriptions are part of Outmap Pro.

Weather tab

  • Right now The current conditions: temperature, snow or rain, and wind. The forecast is provided by AlpineConditions, and the info icon tells you more about the source.
  • Daily forecast A card for each day showing the high and low temperature, expected rain or snowfall, and wind with its direction and gusts. Swipe sideways to see more days, up to 16 days ahead.
  • Coming up (next 36h) An hour-by-hour look at the next day and a half. Swipe sideways to scroll through the hours. Best for: picking the best window to be up high.
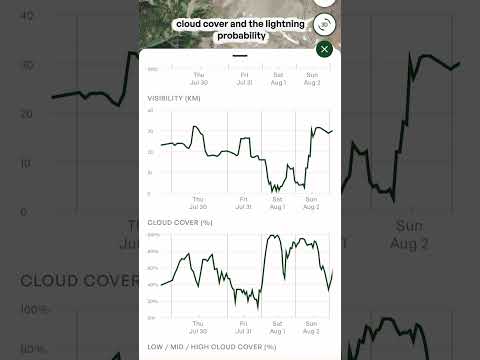
  • The charts Scroll down for charts of precipitation (rain in millimetres and snow in centimetres), snow depth, temperature, wind and gusts, freezing level, visibility, cloud cover, and lightning probability. The freezing level chart shows a line for the objective's own elevation, so you can see when it's below freezing. The charts can also show recent historical conditions alongside the forecast, so you can see what the weather has been doing as well as what's coming.

Actions

  • Save Saves it to your library so you can find it again later. Because everything syncs, it shows up in both the web app and the mobile app.
  • Share Lets you send it to someone else, so they can see exactly the spot you're looking at.
  • Create Route Opens the route planner so you can go straight from "that looks good" to plotting a line. Choose Snap to follow existing trails or Straight to draw straight lines, and use the undo button if you make a mistake. Your ascent, descent, steepness and distance update as you go. Tap Save when you're happy, or Cancel to start over.

Dropping your own waypoint

  • Add a waypoint Tap the plus button on the map and choose Add a waypoint to place a pin anywhere, not just on marked objectives.
  • What you get A panel titled with the nearest town, with a Details tab and a Weather tab for that exact spot, plus Save, Share and Create Route. Best for: checking the weather for a col, a campsite or a line that isn't marked on the map.
Tip:  descriptions are AI-generated, so treat them as a starting point and double-check important details like reservations and rules with the official source before you go. The forecast is for that exact spot, not the nearest town, so it can be very different from what you see in a valley forecast.

Terrain & Planning Layers

Every layer and overlay for understanding the terrain and conditions before you're standing on it.

Slope angle layer
Watch video

Slope angle layer

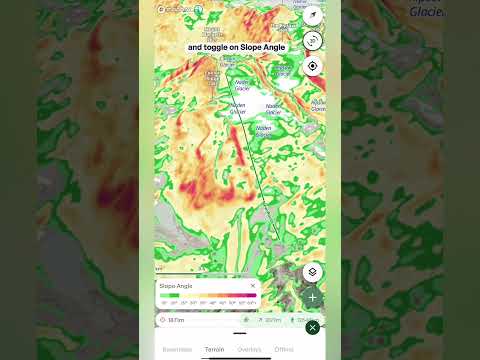
Slope angle shows how steep the terrain is in color bands, so you can see at a glance what's gentle and what's steep.

Read feature guide

Turning it on

  • Open the layers menu Tap the layers button on the map, go to the Terrain tab and tap Slope angle. To turn it off, tap it again. A small number on the Terrain tab shows how many terrain layers are switched on.

Reading the colors

  • The scale A legend card appears on the map with a scale running from 10° to 60° and over. Match any patch of color on the map to the scale to read its steepness.
  • From green to purple The gentlest slopes are green, then the colors warm up through yellow and orange, into red and pink as the terrain gets steep. Purple marks the steepest ground on the map, 60° and over, such as cliffs and rock faces.
  • Slope angle vs Avalanche risk Slope angle shows steepness in small steps, so you can read the angle of any slope. Avalanche risk groups the same angles into a few key bands, so you can see the important range at a glance.

Controls

  • Opacity slider The slider is located at the top of the Terrain layers menu. Drag it down to fade the colors so you can see the satellite imagery or topo map underneath, or up to make the angles stand out.

What it's good for

  • Choosing a line See where the steep pitches are and where the terrain eases off, so you can pick a line that suits your group and the day.
  • Planning the approach Find the gentler ground to travel on, and spot where your route has to cross steeper slopes.
  • Pairing with other layers Use it with Slope aspect, Avalanche risk and the Avalanche forecast overlay to build a fuller picture of any slope before you go.
Aspect layer
Watch video

Aspect layer

Outmap's Slope aspect layer colors the map depending on which direction each slope faces, so you can see at a glance which slopes get the sun and which stay in the shade.

Read feature guide

Turning it on

  • Open the layers menu Tap the layers button on the map, go to the Terrain tab and tap Slope aspect. To turn it off, tap it again.

Reading the colors

  • The compass legend A compass appears in the bottom corner of the map. Each direction has its own color, for example blue means a slope faces north. Match any slope to the compass to see which way it faces.
  • Sun and shade In the northern hemisphere, north-facing slopes get the least sun, so the snow often stays colder and drier for longer. South-facing slopes get the most sun and warm up faster, which can have big implications for avalanche safety. The colors blend between directions, so a slope facing between two directions shows a color in between.

Opacity

  • Opacity slider The slider is located at the top of the Terrain layers menu. Drag it down to fade the colors so you can see the terrain underneath.
Tip: avalanche forecasts normally tell you which aspects to watch out for. Pair Slope aspect with the Avalanche forecast overlay and you can see exactly where those aspects are on the map. Knowing exactly what aspect you're skiing is an essential tool for finding the best snow on the mountain, and for checking it's safe.
Avalanche risk layer
Watch video

Avalanche risk layer

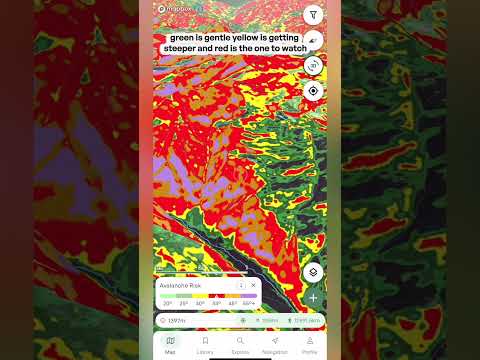
Shade the map by slope angle to see which terrain is steep enough to slide, from gentle green through to the red band where avalanches most commonly start.

Read feature guide

Turning it on

  • Open the layers menu Tap the layers button on the map to open the menu, then go to the Terrain tab and tap Avalanche risk. The map is shaded straight away, and a legend card appears at the bottom of the screen. Open the layers menu again and tap Avalanche risk to switch it off.

Reading the colors

  • Green and yellow, 20° to 34° Green is gentler ground, below the angles where avalanches usually start. Yellow, from 30°, is getting steeper, and avalanches become possible here when conditions are very unstable.
  • Red, 34° to 45° The key band to watch. These are the angles where avalanches most commonly happen, often called prime avalanche terrain. A warning triangle on the legend marks this range.
  • Orange and purple, 45° and over Very steep ground, up to the steepest terrain on the map. Snow on slopes this steep tends to shed in smaller slabs and sluffs.

The info icon

  • What the colors mean Tap the info icon on the legend card for an explanation of how the layer works, plus a diagram of what happens at each slope angle and a link to an article that goes deeper.

Opacity

  • Opacity slider The slider is located at the top of the Terrain layers menu. Drag it down to fade the colors so you can see the satellite imagery or topo map underneath, or up to make the angles stand out.
Important: this layer only highlights the slope angles that avalanches typically form on. Real avalanche danger also depends on the snowpack, the weather and how the slope is triggered. It's for planning only and should never be relied on for critical safety decisions, so use it together with the Avalanche forecast overlay, and always rely on your own training and judgment.
Terrain Shade Layer
Watch video

Terrain Shade Layer

See how the sun shades the terrain at a chosen time of day and date. Drag the time slider to watch the shade move across the mountain through the day.

Read feature guide

Turning it on

  • Open the layers menu Tap the layers button on the map, go to the Terrain tab and tap Terrain shade. The description underneath reads "Sun shade by time of day and date." To turn it off, tap it again. A small number on the Terrain tab shows how many terrain layers are switched on.

The controls

  • Date Pick the day you want to look at from the dropdown, which covers the month before and the month after today. The sun sits at a different angle as the season changes, so set this to the day of your trip. Best for: planning ahead, not just for today.
  • Local time A slider covering the whole day, from 12 AM to 11:59 PM. Drag it to move to a different time and the shaded areas update. The light green part of the slider marks the hours of daylight. The time shown is local time at the spot you're looking at. Best for: finding out when a slope comes into the sun or drops into shade.
  • Opacity slider At the top of the Terrain layers menu. Drag it down to fade the shading so you can see the terrain underneath.

What it's good for

  • Snow quality Slopes that stay in shade tend to hold colder, drier snow, while slopes in the sun warm up. Check a slope at the time you'll be on it.
  • Timing your day Work out when the sun reaches your objective, when a cold start will warm up, and when a slope will fall into shade again in the afternoon.
  • Camp and break spots Find somewhere that gets the morning sun, or somewhere that stays shaded and cool.
  • Photos and video See when the light will reach a face or a ridge, so you can plan when to be there.

‍

Flat Areas Layer
Watch video

Flat Areas Layer

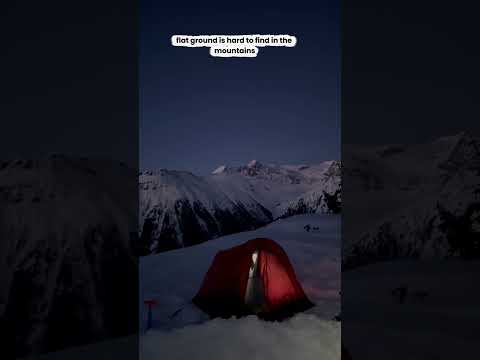
Flat areas lights up all the low-angle terrain in bright green, so you can spot a flat place to camp, swap your skins or take a break before you leave home.

Read feature guide

Turning it on

  • Open the layers menu Tap the layers button on the map, go to the Terrain tab and tap Flat areas. The description underneath reads "Highlights low-angle terrain." To turn it off, tap it again. A small number on the Terrain tab shows how many terrain layers are switched on.

Reading the map

  • Bright green Anywhere that's bright green is flat terrain. The rest of the map stays as it was, so you can see exactly where the flat ground is and how it sits in the terrain around it.

What it's good for

  • Camp spots Find somewhere flat enough to pitch a tent, so you don't have to sleep on an angle all night.
  • Breaks and stopping points Find somewhere to swap your skins, have lunch or take a break, and plan your stopping points along the route.
  • Plateaus and saddles See where the terrain eases off along a ridge or between peaks, so you know where to expect a break in the climbing.
  • Emergencies and bad weather Knowing where the flat ground is can help if you need to be rescued or the weather turns and you want to get off exposed terrain. Low-angle ground can be easier to move across, easier to stop on and a more practical place to stage a rescue, so it's worth knowing your options before you head out.
Important: flat doesn't mean safe. Low-angle terrain can sit below or beside steep slopes, so overhead hazards like avalanche terrain, cornices and rockfall can still be present. Check what's above and around any spot before you stop, shelter or camp there.
Elevation Bands Layer
Watch video

Elevation Bands Layer

Color the whole map by altitude, from light green down low to the darkest bands up high, so you can see at a glance how high everything sits.

Read feature guide

Turning it on

  • Open the layers menu Tap the layers button on the map, go to the Terrain tab and tap Elevation bands. To turn it off, tap it again. A small number on the Terrain tab shows how many terrain layers are switched on.

Reading the map

  • Light green to dark The whole map is colored by altitude. Light green is the lowest ground and the bands get darker the higher you go, so the summits show up as the darkest bands.
  • The scale Look at the scale in the bottom left of the map. It shows which color matches which elevation range, so you can read the height of any spot straight off the map. Best for: tilting the map into 3D and seeing how the mountain stacks up from valley to summit.

What it's good for

  • Matching the forecast Weather in the mountains changes with elevation. Plot a route, check the freezing level in the route's Weather tab, then use Elevation bands to see exactly which parts of your route sit above or below it.
  • Treeline If you know roughly where the treeline sits, you can see where your route climbs out of the trees and into more open terrain.
  • Judging the climb See how much height you gain and where the big steps up are, without reading contour lines.
  • Comparing objectives See at a glance which peaks, ridges and basins sit higher than the others around them.
  • Pairing with other layers Use it alongside layers like Slope angle to build a fuller picture of the terrain.
Custom Terrain Layer
Watch video

Custom Terrain Layer

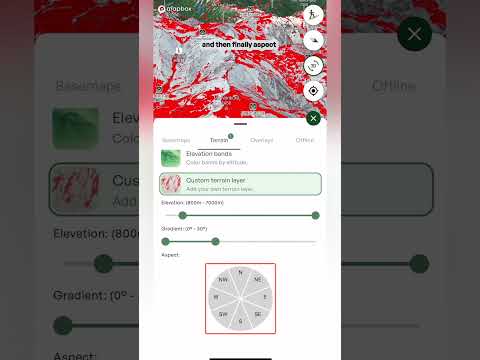
Build your own layer by choosing an elevation range, a gradient range and the aspects you want, and the map highlights only the terrain that matches all three.

Read feature guide

Turning it on

  • Open the layers menu Tap the layers button on the map, go to the Terrain tab and tap Custom terrain layer. The controls for building your layer appear underneath.

The three filters

  • Elevation Drag the two handles to set the lowest and highest elevation you want. The range is shown above the slider. For example: if the forecast says rain below 1,800 metres, set your range from 1,800 metres up to stay in the snow.
  • Gradient Drag the two ends to set how steep the terrain should be (it's called Angle on the web app). The range in degrees is shown above the slider. For example: if the avalanche risk is high, you may want to stay on slopes under 30 degrees, so choose 0 to 30 degrees.
  • Aspect Tap the directions on the wheel to choose which way the slopes face. Selected directions turn green (coral on the web app), and the ones you've chosen are listed above the wheel. For example: after a warm, sunny spell, tap north, northwest and northeast to find the colder, drier snow.

On the map

  • The highlighted terrain Only the terrain that matches all three filters at once is shown, highlighted in red. Change any filter and the map updates.
  • The legend A small card at the bottom of the map shows the settings you've chosen, so you can see at a glance what the layer is showing.
Tip:  a custom layer narrows down where to look. Use it to find the terrain you want, then check conditions and the Avalanche forecast before you commit to a line. Steeper slopes above a gentle slope can still slide onto it, so look at what's above you too.

‍

Heatmap layer
Watch video

Heatmap layer

Use the heatmap layer to see where people have actually been skiing, hiking, climbing and riding. It's built from real recorded activities, so it shows which routes and trails get used in any area. That makes it a quick way to find an established line, see how popular somewhere is, or spot the quieter ground around it.

Read feature guide
Backroad status
Watch video

Backroad status

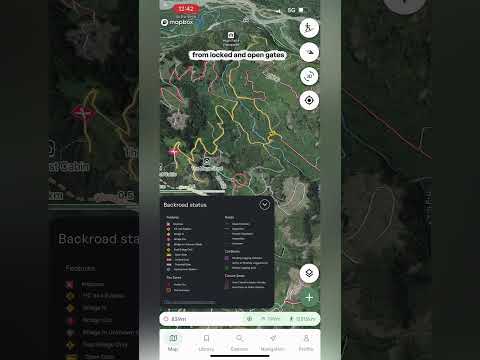
See the condition of backcountry roads in BC and Alberta before you drive them, from good, to degraded, to heavily degraded, to impassable, plus bridges, gates and closures.

Read feature guide

Backroad status colors the forestry and backcountry roads on your map by their condition, so you can check the road to the trailhead before you leave home. The layer covers BC and Alberta.

Turning it on

  • Open the layers menu Tap the layers button on the map, go to the Overlays tab and tap Backroad status. The description underneath reads "Road access updates for BC and Alberta." To turn it off, tap it again.
  • The legend A Backroad status legend appears at the bottom left of the map. Tap it to open it, and tap the arrow to tuck it away again.

Reading the map

  • Roads Every road is colored by its condition: green for good, yellow for degraded, red for heavily degraded, a black dotted line for impassable and a grey dashed line for unknown. Best for: spotting which sections of a road to trailhead are rough before you go.
  • Features Icons mark the things that can stop you: an impasse, a high-clearance 4x4 bypass, a bridge in, a bridge out, a bridge in an unknown state, a foot bridge only, and open, locked and potential gates.
  • Fire zones Active fires and fire perimeters are marked on the map.
  • Cut blocks Pending logging activities, active or recently logged areas and retired logging areas.
  • Closure zones Areas that are closed to motor vehicles, and areas that are open to them.

Recent bulletins

  • Backroad Status website At the bottom of the legend there's a link to backroadstatus.com, which is where the road data comes from. Open it to read the recent bulletins, with updates from people who have recently done the road, like a note about a section of road. Best for: checking the latest word on a road, a bridge or a gate before you drive it.
Important: road conditions change quickly, and a bulletin might be days old by the time you read it. Check the date on any report, and be ready to turn around if the road isn't what you expected. Always rely on your own training and judgment.
Weather For a Point or Route
Watch video

Weather For a Point or Route

Open a waypoint or a saved route and tap the Weather tab to see the forecast for that exact spot: current conditions, a day-by-day forecast, an hour-by-hour look at the next 36 hours, and charts for things like precipitation, snow depth, temperature, wind and the freezing level.

Read feature guide

Routes & Waypoints

Plan the line, mark the spot, then track it for real.

Your Route Breakdown
Watch video

Your Route Breakdown

Once a route is saved, Outmap tells you how long it'll take, which way it faces and what the weather's doing, before you've taken a single step.

Read feature guide

What you'll see

  • The header A saved route opens with its name and tags for the route type and activity. It has three tabs: Details, Content and Weather.
  • Travel estimate At the top of Details, Plan for shows the total time, split into your moving time and your breaks and transitions. Best for: knowing how long to plan for, and whether you'll have enough daylight.
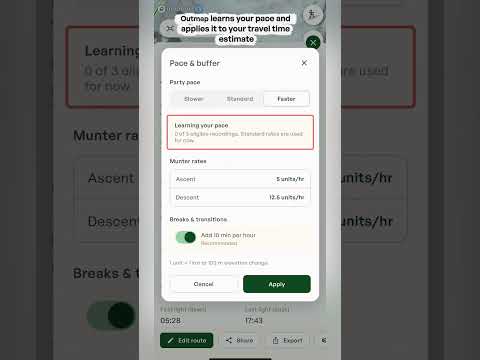
  • Pace & buffer Tap it to match the estimate to how you actually move. Choose your party pace, Slower, Standard or Faster, and switch on breaks and transitions to add 10 minutes per hour to your estimate. Once you start recording activities, Outmap also learns your own pace and uses it.
  • The Munter method Outmap works out your moving time using the Munter method, which is based on the distance and elevation change of your route. Tap the info icon to read the full explanation.
  • Aspects A compass-style diagram in the top right. The directions that are filled in show which way the slopes along your route face. Best for: seeing at a glance whether you're crossing north, south, east or west facing terrain.
  • Location, and Sun & Moon The local time and timezone, plus sunrise and sunset, first and last light, and the moon, just like a waypoint.
  • Content tab The place to organise your route. Change its activity type, pick a colour for it, add photos, file it into a list and write private notes.
  • Weather tab The same forecast you get for a waypoint: current conditions, day-by-day and hour-by-hour forecasts, and charts for things like precipitation, snow depth, temperature, wind and the freezing level.
Important: the travel time is an estimate based on distance and elevation change. Terrain, conditions and fitness can all affect your actual time, along with the snow, the weather and your group, so treat it as a starting point.
Creating a waypoint
Watch video

Creating a waypoint

Drop a waypoint anywhere on the map to remember a peak, a secret pow stash or a campground, then plan your way there.

Read feature guide

A waypoint is a pin you can drop anywhere on the map, not just on marked objectives. Drop one to remember a place and how to get back to it.

Dropping a waypoint

  • Line up the red dot Move the map until the red dot in the middle of your screen is over the spot where you'd like your waypoint.
  • Add a waypoint Tap the plus button in the bottom right and select Add a waypoint. The pin drops on the red dot.
  • Name it Outmap names the waypoint after the closest town to start with. To change the name, tap Save and type in the name you'd like.

What you see straight away

  • Elevation and "to you" Under the name is the waypoint's elevation, and a "to you" bar showing the height difference, the distance and the bearing from where you're standing. The T next to the bearing means true north. Best for: a quick sense of how far away a spot is in distance and elevation.
  • Details tab The exact coordinates, with a copy icon to copy them in one tap. Underneath are the local time and timezone, the elevation, the nearest town and a button to open the spot in another maps app, plus sunrise and sunset, first and last light and the moon. Best for: sending a precise location to a friend, or pasting it into another app.
  • Weather tab A forecast for that exact spot on the map, with an hour-by-hour forecast and a day-by-day forecast for the next 16 days.

Making it yours

Once it's saved, a Content tab appears alongside Details and Weather.

  • Icon and color Choose an icon for the waypoint, like a tent, a camera or a climber, and pick one of seven colors, so you can tell it apart on the map.
  • Photos Tap Add photo to attach photos to the waypoint.
  • Lists File the waypoint into one of your lists to keep it organized.
  • Notes Write private notes, like how you got there or what to look out for.
  • Public visibility A switch decides whether the waypoint is public. When it's on, anyone can see the waypoint on the public map, so turn it off if it's a spot you want to keep to yourself.

Along the bottom

  • Edit location Dropped it in the wrong spot? Tap Edit location to move it.
  • Share Send the waypoint to someone else.
  • Export Export the waypoint to use it somewhere else.
  • Create Route Opens the route planner so you can plot how you get there.
Plot an Area
Watch video

Plot an Area

Outline any zone on the map, like somewhere to ski with a friend or an area you want to avoid, and Outmap tells you how big it is, what the weather's doing and how much daylight you've got. Then you can share it with a friend.

Read feature guide

Sometimes you want to mark out a whole zone, not just a line. Plot an area lets you outline it right on the map, then check the weather and daylight for it.

Starting an area

  • Plot an area Tap the plus button on the map and choose Plot an area.

Drawing the shape

  • Tap to add points Tap the map to drop each corner of your area. The length of each side and the total area in square kilometres update as you go, and the distance around the edge shows in the panel.
  • Undo Tap the undo button at the bottom left of the map to take back your last point.
  • Color Pick one of seven colors for your area, so different zones are easy to tell apart.
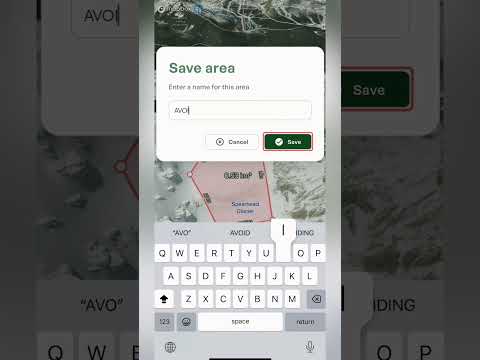
  • Save or cancel Save stays greyed out until your points make a shape. Tap Save, give the area a name, and it stays on your map with its name across the middle. Tap Cancel to throw it away.

Once it's saved

Once it's saved, the panel shows the area's name, how many points it has, its size in square kilometres and the distance around the edge. It also has three tabs: Details, Content and Weather.

  • Details The local time and timezone, plus sunrise and sunset, first and last light, and the moon.
  • Content Change the color, add photos, file the area into one of your lists and write private notes.
  • Weather The forecast for the zone, with current conditions and a day-by-day table. Use the range selector to look at the next 24 hours, 3 days, 7 days or 16 days, and the charts underneath cover things like temperature, precipitation, wind, the freezing level, cloud cover and snow depth. Best for: checking what a day in that zone will be like before you commit.

Along the bottom, you can edit the area, orbit around it in 3D, or share it with someone else.

What it's good for

  • Zones to avoid Outline somewhere you've decided to stay out of, like a closed area or a spot you've been told to avoid, and give it a color that stands out.
  • Zones to ski or climb Mark out the zone you plan to ski or climb, then share it with a friend so you both know exactly where you're headed.
  • Measuring See how big a glacier, bowl or basin is, and how far it is around the edge.
  • Weather for a zone Get a forecast for the whole zone, hour by hour or day by day, without placing a waypoint or plotting a route.

Library, Sharing & Community

Everything you've saved, and how to pass it on.

New lessons coming soon.

Import, Export & Integrations

Move your data in, out, and in sync with your other gear.

New lessons coming soon.

Offline & Downloads

Losing signal shouldn't mean losing your plan.

Downloading Offline Maps
Watch video

Downloading Offline Maps

Losing signal doesn't have to mean losing your map. Download any area of the map, or the stretch of terrain along a route, to your phone before you go, with the basemap, satellite imagery and terrain layers you choose, so it all still works with no service. There's no fixed limit on how much you can save, only the free space on your phone. Offline maps are an Outmap Pro feature, available in the mobile app.

Read feature guide

Downloading an area

  • Starting an area download On the map, tap the plus button in the bottom right and choose Download map. You can also tap the layers button, go to the Offline tab and tap Download map at the bottom.
  • Position the download box A green box appears on the map, so drag and zoom until it covers the area you want to save. Everything inside the box gets downloaded.
  • The measurements The length of the box's sides is shown along its edges, for example 3.8 km. The box is a square, so both sides match. Use it to see how big the area is as you move and zoom.
  • Choose what to save Pick Topo only, Satellite or Satellite HD. Each option shows an estimated download size. With satellite you can also choose the imagery, Maxar, Mapbox or Winter Beta, and you can tick the terrain layers to save too: Slope angle, Slope aspect, Avalanche risk, Flat areas and Elevation bands. Saved layers keep working with no signal. Then tap Download map at the bottom of the panel, enter a region name you'll recognise later, like the name of the area or objective, and tap Download. To back out, tap Cancel.
  • Best for A mountain range, the surroundings of a hut, or a trip without a fixed route. If you only want to follow a route, use a route download instead, which follows the shape of the route.

Downloading a route

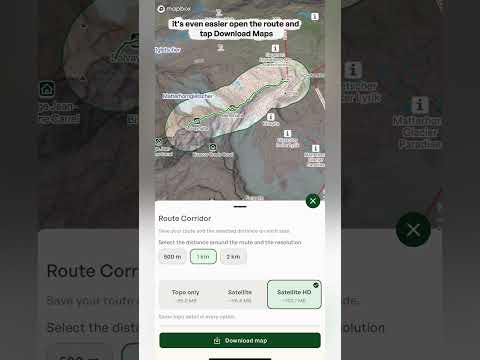
  • Download maps Open a saved route, swipe along the row of buttons at the bottom of the route panel and tap Download maps. A panel called Route Corridor opens, saying "Save your route and the selected distance on each side." Instead of a square, Outmap saves a strip of map that follows the shape of your route.
  • Choose the distance Choose how far around the route to save: 500 m, 1 km or 2 km. The outline on the map widens as you change it, so you can see how much terrain each option covers. A narrow corridor takes less space, and a wider one gives you more terrain around the route for side trips and exits. Best for: long routes, where a square would waste space on places you'll never go.
  • Sizes change with the width The size estimates for Topo only, Satellite and Satellite HD go up as the corridor gets wider, and they depend on how long the route is. For example, a 2.7 km hike came to roughly 90.0 MB for Topo only, 93.0 MB for Satellite and 97.7 MB for Satellite HD with 500 m on each side, and Satellite HD rose to about 101.4 MB at 1 km.
  • Choose what to save Then pick Topo only, Satellite or Satellite HD, and any terrain layers you want, the same choices you get for an area. Give it a name and tap Download.

Managing your offline maps

  • The Offline tab Open the layers menu and go to the Offline tab. Before you've saved anything it says "No maps downloaded yet". Once you have, the heading shows how many maps you've saved, like Offline Maps (2), and each one is listed with a thumbnail, its name and its size. You can also check when each one was last updated and how much space it takes.
  • Download before you leave You need a connection to download, so save your maps before you head out of signal, ideally on wifi. Check that the download has finished in the Offline tab before you go.
  • Storage There's no fixed limit on how much offline map data you can save. The limit is the free space on your phone, and Outmap keeps some in reserve so your phone doesn't fill up completely.
  • The three dots menu Tap the three dots next to a map for more options. Rename map lets you change its name, Delete map removes it from your phone, Validate offline map lets you check a saved map, and Resume download picks up a download that was interrupted, so you don't have to start again.
Tip: save your maps before you leave, then check the map still loads with your phone in airplane mode. Offline maps hold the map and the terrain layers you chose, but live information like weather and avalanche forecasts needs a connection to update, so check those before you lose signal.

Plan easily on your computer before heading out

Get total flexibility and import GPX tracks, export your own adventures to share with your crew. Your routes, always portable and ready to go.

Start planning on desktop